(Part 4) SLO Implementation: Alerting

I’m pretty excited to be writing this blog post, as it is the final one in our SLO Implementation series.
In this final post, we’ll discuss using Prometheus Alerting Rules and Alertmanager to notify us when our blog is violating its SLO. Adding this alerting ensures we will be aware of any severe issues our users may face, and allows us to minimize the error budget spent by each incident.
Alerting Strategies
Our first step is deciding the algorithm we’ll use to determine when we receive an alert. The Site Reliability Workbook has useful guidance in this area. At the highest level, they state our goal “is to be notified for any significant event: an event that consumes a large fraction of the error budget.” They then define four categories by which we can measure an alerting strategy: Precision (i.e. proportion of events detected that were actually significant), Recall (i.e. proportion of actual significant events detected), Detection time (i.e. how long it takes us to notify during a significant event), and Reset time (i.e. how long after an issue is resolved before the alert stops firing).
The workbook presents two main categories of alerting strategies. In the first, we compare the current SLI measure to the SLO threshold, and alert when the current measure is outside the threshold. We can tune both the timeframe over which we calculate the “current” SLI measure (i.e. aggregate over 10m, aggregate over 1d, etc.) and also how long we require the current SLI measure to be outside the SLO threshold before we alert.
Another option is alerting on burn rate, which is “how fast, relative to the SLO, the service consumes the error budget.” Again, there are a variety of parameters you can tune when utilizing this strategy, such as alerting on multiple different burn rates and also having multiple windows over which you calculate burn rate. From my reading, this approach offers the best balance of precision, recall, detection time, and reset time. However, it is decidedly non-trivial to implement and reason about.
In the end, we have two options. We can take the simpler strategy to implement and accept its shortcomings with respect to precision, recall, detection time, and/or reset time, or we can take the more complex approach and accept the difficulty of implementation and maintenance.
In the spirit of releasing MVPs, I chose the first option, and decided to alert based on comparing the SLI measure to the SLO threshold. Specifically, we’ll receive an alert if our SLIs for availability and latency, as measured over the last hour, are outside of the SLO threshold for more than 15 minutes.
# Availability
sum(rate(caddy_http_response_status_count_total{service="blog",status!~"5.."}[1h])) / sum(rate(caddy_http_response_status_count_total{service="blog"}[1h])) < .99

# Latency
histogram_quantile(0.99, sum(rate(caddy_http_request_duration_seconds_bucket{service="blog"}[1h])) by (le)) > 1
This alerting strategy has a fairly high precision, as if we are outside of the SLO thresholds for > 15 minutes, there is very likely an issue. Additionally, it has a fairly good reset time, in that it takes at most an hour after an incident is resolved for it to stop impacting alerting decisions. However, it does not have great recall or detection time. Specifically, if we have a 100% outage, we would still have to wait at least 15 minutes before receiving an alert, at which point we could’ve burned our entire error budget. Additionally, forcing the SLI to be outside of the SLO threshold for 15 minutes introduces the risk of the SLI oscillating around the threshold but never spending a full 15 minutes outside of it. In this situation, we don’t receive an alert even though there may be a real issue.
Still, despite its flaws, I think our chosen alerting strategy will be sufficient for an MVP. So let’s move on to implementation!
Adding Prometheus Rules for our Alerting Strategy
Prometheus supports AlertRules, which allow us to use Prometheus expression language to define an alert condition, and send notifications about any firing alerts to an external service.
CoreOS’ Prometheus Operator
provides the
PrometheusRule
custom resource, which allows us to both specify a Prometheus alert rule. In the
file below, you can see we’ve created three alert rules. The BlogDown alert
checks if the blog is not functioning at all, while the SLOLatencyFailure and
SLOAvailabilityFailure alerts utilize the previously discussed alerting
strategy to check if our blog is operating within its SLO.
I’ve included the template file, with line by line documentation, below.
We also must add a ruleSelector field to our Prometheus clusters’ spec. This
ruleSelector field instructs our Prometheus cluster that it should alert on
any rules with label role=alert-rules. You can see the changed element of the
Prometheus manifest below. For now, ignore the alerting field, as we’ll
examine it in the next section.
After applying both of these manifests to our Kubernetes cluster, our Prometheus
cluster will now regularly execute the queries defined in our alerting rules,
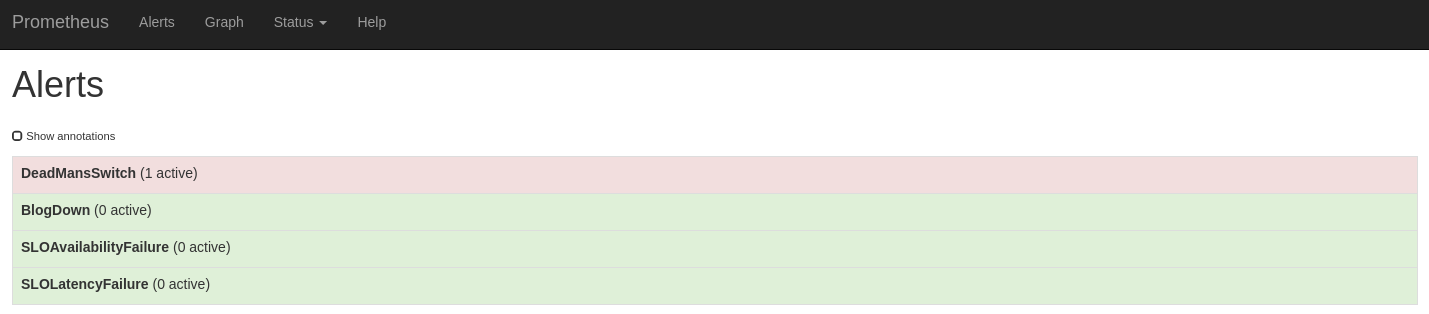
and raise an alert if necessary. If you navigate to the /alerts endpoint on
your Prometheus cluster UI, you should see the
image below. Please ignore the DeadMansSwitch alert, its just intended to
ensure that our alerting pipeline is working.
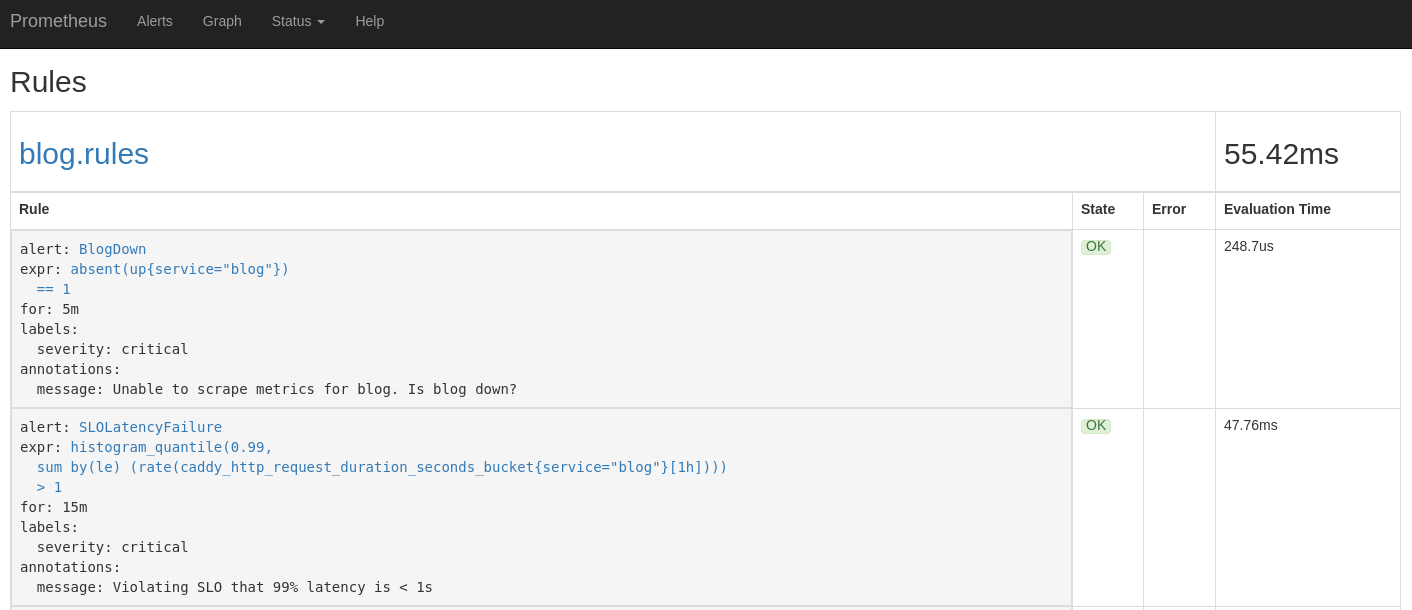
Additionally, if you navigate to the /rules endpoint on your Prometheus
cluster, you’ll receive in-depth information about your Prometheus cluster’s
currently configured alert rules.
Deploying Alertmanager
Prometheus alerting rules are concerned simply with noticing something is wrong and raising a simple alert. They are not intended to be responsible for the more nuanced processing if processing raising alerts, such as routing them to different channels (i.e. Slack, Opsgenie, etc.), grouping related alerts, etc. Alertmanager fulfills said role within the Prometheus ecosystem, so our next goal is deploying Alertmanager and configuring our Prometheus cluster to send all alerts to our Alertmanager cluster, which will then process them appropriately.
For this specific example, we’ll be configuring AlertManager to route all critical alerts to Opsgenie, and to do nothing on all non-critical alerts. For those who are curious, I chose Opsgenie for the simple reason that it offers a free tier and PagerDuty doesn’t. For now, my alert escalation policies are so simple that the functionality differences between the platforms have no real impact. If you intend to exactly replicate the SLO implementation described in this blog, you’ll want to sign up for a free account with Opsgenie before progressing to the later steps.
First, we need to create an Alertmanager configuration
file, which we’ll
eventually connect to the Alertmanager cluster running on Kubernetes.
At a high level, the file below directs Alertmanager to send all alerts with the
severity=critical label to Opsgenie and swallows all other alerts.
This configuration file ultimately must include our Opsgenie API key, which we
should treat as a secret and not check into source control. However, we still
want the remainder of the file in our Git repo, so we treat this configuration
file as a template file. We specify opsgenie_api_key: ${OPSGENIE_API_KEY} and
then use envsubst to fill in the template when necessary. We never save an
actual file with the OPSGENIE_API_KEY in source control.
export OPSGENIE_API_KEY=...
cat alertmanager-config.yaml.sample | envsubst > alertmanager-config.yaml
And here’s the configuration file.
We have our configuration defined, but we need a way to associate it with the
Alertmanager cluster which we’ll be deploying. The Prometheus Operator
documentation
specifies that an Alertmanager resource will load its configuration from the
alertmanager.yaml data element in a
Secret titled
alertmanager-$ALERTMANAGER_NAME.
A Secret is a Kubernetes resource responsible for storing a small amount of sensitive information. Pods with access to the secret can then access the sensitive value either through exposing it as an environment variable or mounting it as a volume into the container.
Multiple methods exist for creating secrets. Ideally, we would prefer to check a manifest file for our Secret resource into source control. However, as the Kubernetes documentation highlights, the base64 encoding of the sensitive information in the Secret manifest does not provide any cryptographic security, and we must treat a Secret manifest file as sensitive, and we definitely do not want to check sensitive information into source control.
We solve this problem similar to how we did with specifying the Opsgenie API key
in our Alertmanager configuration file. We create a secret.yaml.sample file,
which specifies alertmanager.yaml: ${ALERTMANAGER_YAML_BASE64} as its singular
data element. You can see the full file below.
We can then run the following sequence of commands to create the
actual secret.yaml, which we git ignore. We can keep the
secret.yaml on our local disk, meaning kubectl apply -f templates/ still
applies manifests for all our Alertmanager resources. You only need to run the
below commands to regenerate the secret.yaml when Alertmanager configuration
changes, Opsgenie credentials change, or when you first clone the Git
repository.
export OPSGENIE_API_KEY=...
export ALERTMANAGER_YAML_BASE64=$(cat alertmanager-config.yaml.sample | envsubst | base64 | tr -d '\n')
cat secret.yaml.sample | envsubst > secret.yaml
It’s now smooth sailing for deploying Alertmanager, as our overall approach has many parallels with deploying Prometheus to our Kubernetes cluster. First, we create a simple manifest for the Alertmanager custom resource, specifying we would like a Alertmanager cluster with two replicas (i.e. high availability).
Then, we create a service which allows us to access our Alertmanager cluster.
As we’ve discussed in previous posts in this SLO implementation series,
I haven’t yet configured
HTTPS for my services. As a result, we cannot do any form of meaningful
authentication, and as a result, I’m hesitant to expose Alertmanager to the
public internet. So we ensure our service is not accessible externally, and then
use kubectl port-forward svc/alertmanager 9093:9093 to form a secure
connection when necessary.
Our final step is updating the alerting.alertmanagers value on our Prometheus
resource, to specify that our Prometheus cluster should send alerts to the
Alertmanager cluster we just created. The exact syntax necessary for updating
the manifest can be seen below.
And with that, Alertmanager should be good to go. See my personal-k8s for every necessary manifest, as I continue to punt on describing RBAC in my blog posts. We’ll get to it soon, I promise.
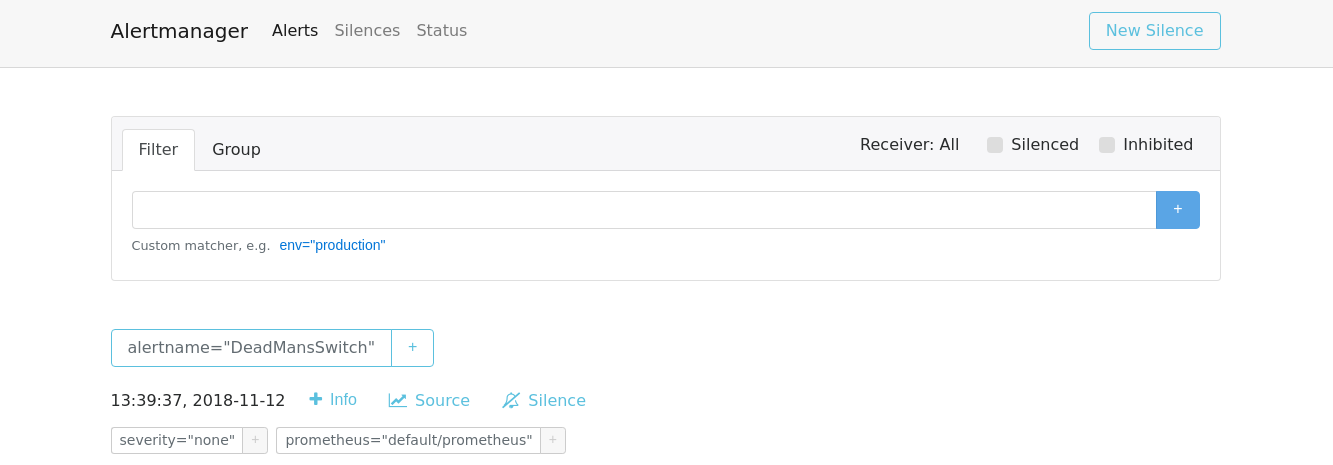
After its up and running, and you’ve run the port-forwarding command, you should
be able to navigate to localhost:9093 and see Alertmanager (pictured below).
You also should start receiving alerts via Opsgenie whenever Prometheus fires an
alert..
Wrapping it up
Congrats, we made it to the end! Remember, in the first post, we said “our goal for this project is to create the monitoring infrastructure which will allow us to monitor metrics pertaining to our SLO, and alert me when this blog is violating its SLO.” I think we accomplished all those objectives, and am looking forward to how monitoring this blog’s SLO will help me ensure it provides a consistent level of service.
Thank you for reading this series, and please reach out in the comments if you have questions about any part of the process. To be honest, I’m not sure what the next Kubernetes project I’ll tackle is (maybe trying to spend less money on my personal cluster…), but please stay tuned because I’ll definitely blog about whatever it ends up being.