(Part 2) SLO Implementation: Prometheus Up & Running

For all of you just itching to deploy another application to your Kubernetes cluster, this post is for you.
In it, I’ll be discussing deploying Prometheus, the foundation of our planned monitoring and alerting, to our Kubernetes cluster. This post will only discuss getting the Prometheus cluster running on our Kubernetes cluster. I’ll leave setting up monitoring, alerting, and useful visualizations for a later blog post in the series.
Deployment Strategy
The last application we deployed via Kubernetes, this blog, required us to write the all aspects of the configuration from scratch. We could pursue the same strategy when deploying Prometheus onto our Kubernetes cluster, defining from scratch the needed Pods, Deployments, Services, ConfigMaps, Secrets, etc. However, doing so would be like writing my own web server to serve this blog’s static content. Sure we could probably do it, but it’d be complicated, and at the end of they day, we’d have something worse than what already was available in the open-source community.
We’d much rather utilize a method that’s been developed and tested by the active Cloud Native community. Not only does utilizing a community method decrease the initial cost of deploying Prometheus, but it also decreases the long-term maintenance cost, as I can rely on bug fixes and debugging assistance from the community. Yay open source!
A couple of different community supported methods exist for deploying a Prometheus cluster onto a Kubernetes cluster.
The simplest option comes from the
folks at Giant Swarm. It’s a collection of static
manifests one can use for deploying a Prometheus
cluster. Essentially, we
could clone their repo, run kubectl apply -f manfiests-all.yaml and we’d be up
and running. However, we would only be able to manage our Prometheus cluster by
interacting with low-level Kubernetes API objects, such as Pods and Services,
with the manifest files. While we don’t mind that method for small applications,
like this blog, it can become unwieldy with a more complex application like
Prometheus.
For a little more flexibility, we could use the Prometheus Helm Chart. I plan to discuss Helm and Charts in much greater depth in future blog posts, but at a high level, we can think of them as a package manager for Kubernetes. Instead of directly interacting with static manifest files and low-level Kubernetes API resources, we define the Chart as a higher level abstraction. You can template the helm chart with custom values and easily share them publicly. Helm also offers tools for managing the deployment of charts, with both upgrades and easy rollbacks. There are a ton of community contributed Helm charts for installing popular applications, and fortunately, Prometheus is included.
Finally, we have the option of using Operators, an exciting recent method of packaging, deploying, and managing a Kubernetes application. Similar to Helm Charts, Operators provide more application specific resources with which we can interact. Operators are quite elegant in their design and implementation, so I’ll do a deep dive into how they work in the next section. Spoiler alert, CoreOS has developed a fantastic Prometheus Operator, and we’ll use it to deploy our Prometheus cluster.
A history of Custom Resource Definitions, Controllers, and Operators
Custom Resource Definitions
From the beginning, Kubernetes defined a number of lower-level resources (or objects), like Pods, Services, ConfigMaps, etc. We could only perform CRUD operations on these objects.
Over time, users started wanting Kubernetes objects to be more high-level.
Instead of interacting with Deployments, Services, and ConfigMaps, we wanted to
interact with applications. For example, we wanted to be able to run kubectl get prometheus and see all Prometheus clusters running on our Kubernetes
cluster just like we can run kubectl get pods and see all pods running on our
Kubernetes cluster.
Kubernetes supported this desire via
custom resource definitions.
When we create a new CustomResourceDefinition object, we can then interact
with the API server to read/write information about our custom object. We can
achieve the above goal of running kubectl get prometheus and seeing all
running Prometheus clusters.
Controllers
We’ve introduced a new custom object to the Kubernetes API. However, we haven’t explained how Kubernetes actually knows what actions to perform when CRUD operations are performed on that API object. In other words, when we tell Kubernetes to create or delete an instance of our Prometheus object, how is Kubernetes to know what to do?
A brief look at Kubernetes architecture illuminates how we can make this possible. Kubernetes runs an API server, to which the user could send requests, which will read/write resources from/to Etcd’s persistent storage. It also contains the Control Plane, which is comprised of the Controllers which are responsible for ensuring the state declared in the persistent storage is reflected on the cluster. In other words, if we send an request to the Kubernetes API specifying there should be a Deployment containing five pods running an Nginx container image, then the DeploymentController, is responsible for ensuring said pods are actually running on some worker nodes.
We can follow the exact same pattern for the higher level object defined via the CustomResourceDefinition. Specifically, we deploy our own custom Controller to the Kubernetes cluster. It is responsible for interacting with the Kubernetes API and translating our CustomResourceDefinition into native Kubernetes concepts. For example, if our Controller sees it must create a new Prometheus cluster, it will use the Kubernetes API to create the appropriate Pods, Secrets, etc.
Operators
An Operator couples CustomResourceDefinitions and Controllers with operational knowledge to allow us to deploy and manage an application, at a high level of abstraction, entirely via the Kubernetes API. Similar to a cloud provisioned service (i.e. Amazon’s RDS), we can just specify we want an application, and the operator will perform all the necessary actions for it to exist.
Using the Prometheus Operator to deploy a Prometheus Cluster
With a solid understanding of CustomResourceDefinitions, Controllers, and Operators, we are ready to deploy our Prometheus cluster.
Our first step is deploying the Prometheus Operator to our Kubernetes cluster. We define templates for a couple different Kubernetes objects. Unsurprisingly based on our previous discussion, we need to specify the CustomResourceDefinition objects. We define a CustomResourceDefinition object for each high level Prometheus concept, so we have CRDs for Prometheus, PrometheusRule, ServiceMonitor, and AlertManager. We’ll examine the code for interacting with these CRDs shortly. We also specify a Deployment object responsible for ensuring our custom Controller is running and translating our CustomResourceDefinitions into the proper native Kubernetes objects. Note, to keep this blog post focused, I’m ignoring all RBAC-related manifests. I’ll be diving into RBAC in the future on this blog.
All manifests are available
here,
and running kubectl apply -f applications/prometheus-operator/templates after
cloning personal-k8s will
actually deploy the operator to your cluster. These manifests are based on the recommended install
strategy
from the good folks at CoreOS.
Now that we have the Prometheus Operator deployed, we can use it to create a Prometheus cluster. We’ll make use of the Prometheus and ServiceMonitor CustomResourceDefinitions we created when deploying the operator, as well as deploying a Service so we can access our Prometheus cluster.
We start with the manifest for our Prometheus custom resource. I’ve written in-depth
comments in the script, but at the highest level, this manifest specifies we
want a Prometheus cluster with two replicas. This cluster should scrape metrics
from all ServiceMonitors which match the app=blog label.
We progress to the manifest for our ServiceMonitor resource. A
ServiceMonitor specifies the services in Kubernetes from which our Prometheus
cluster should pull metrics. It is quite useful, as it means we don’t have to write a
Prometheus config file, which can be
non-trivial
when trying to monitor an application running on Kubernetes. The embedded gist
provides line by line documentation, but overall this manifest specifies we will
monitor services matching the app=blog label.
After applying the two manifests above, we should have a Prometheus cluster
running and scraping metrics from the services we specified. Our final step is
creating a Service to support us accessing our Prometheus cluster. For now, we
create a Service with the ClusterIP type, because we do not want to expose
this Prometheus cluster to the public internet as does not have authentication
or encryption. Fortunately, we can still access it via port forwarding.
If we run kubectl port-forward svc/prometheus 9090:9090, then the Prometheus
cluster UI will be accessible via localhost:9090.
Again, to keep this blog post focused, I’m ignoring all RBAC-related manifests.
All manifests are available
here,
and running kubectl apply -f applications/prometheus/templates after
cloning personal-k8s will
actually deploy the Prometheus cluster to your k8s cluster. Once the cluster is
deployed, you can run the port forwarding command listed above to ensure you can
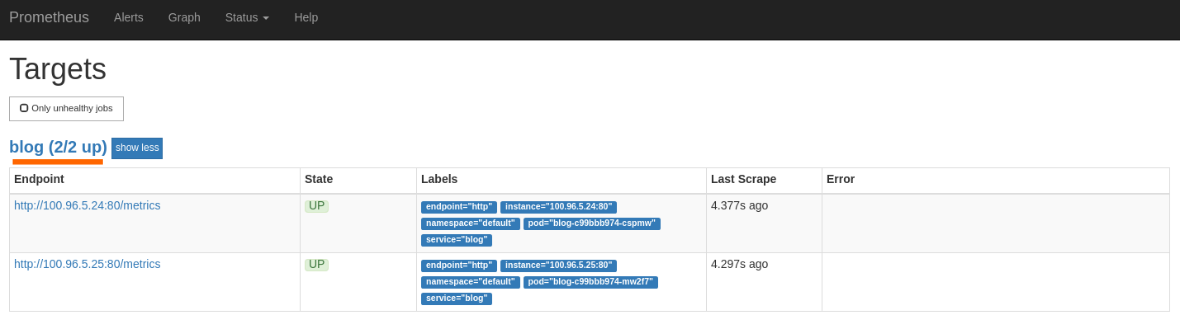
successfully connect. If you navigate to localhost:9090/targets, you should
see that your successfully scraping the blog endpoint.
Wrapping Up and Moving Forward!
Phew! We made it - thank you for sticking with me for this longer post.
In the next posts in this series, we’ll focus on configuring a Grafana dashboard to track our SLO/Error Budget indicators, and then in the following, and final, post, we’ll configure alerting around these indicators. Should be fun!